Heading 1
Duration, Resource or Cost Curves
The benefits of S Curves in Project Management to visualize progress is well understood. By analyzing S Curves we can quickly identify slippage, and potential problems that could adversely impact the completion of the project if no remedial action is taken.
To get past this obstacle the accepted solution is to create time phased reports in the PM software and export the data to Excel and by using Pivot tables and charts, create S Curves. This is both time consuming and requires a fairly high level of knowledge of both pieces of software involved. It could also lead to inaccuracies if the correct steps are not followed.

However, this comes at a cost. The most popular Project management software systems do not have an easy to use facility to create S Curves, if at all.
ProjectTracker is a standalone tool that creates S Curves from Primavera P6 and Microsoft Project at the click of a button and generates S Curves in seconds, without the need for Excel. The complete set of project data is imported allowing filtering on WBS, Activity Code or Resource to create multiple curves which can be produced in a fraction of the time taken by the Excel method.
Project Tracker will pay for itself after one update period and allow you to add more value to your project reporting. It is used widely in the construction, civil engineering, manufacturing, oil and gas and power industries worldwide.

Often, one S Curve is produced to give a visualization of project progress, but often this is not enough. Consider a multi-disciplinary program: assessment of the overall program is just one part of the picture. The schedule may be on target but one discipline maybe falling behind where others are ahead. To achieve this detailed analysis we need to create an S Curve for each discipline. This will increase, further, the time taken to produce reports using the export to Excel method.

Feedback shows that the creation of S Curves can take anything up to 20 hours for a complex project with multi disciplines. Even a single report can take several hours per update period.
Many consider this acceptable, but what if we could use that time for actually managing and completing the project..
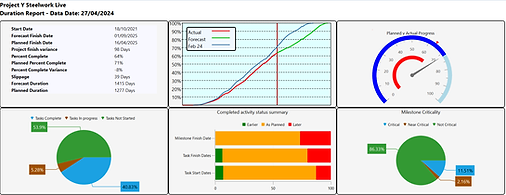
Dashboard View
Project Management S Curves
PROJECTTRACKER WILL CREATE S-CURVES BASED ON DURATION WHICH MEANS YOU DON'T NEED TO ALLOCATE RESOURCES OR COSTS TO YOUR PROJECT
“”
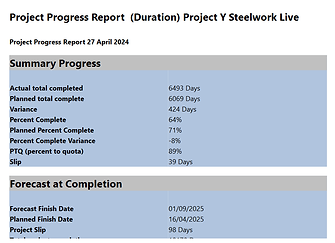
Text Based Report
Slip Trend Report
Slip Trend graph translates the slip each day into a trend graph or histogram to show whether the project performance is improving or degrading.

Quality Report
A DCMA quality report is a report that analyzes the quality of a project's schedule

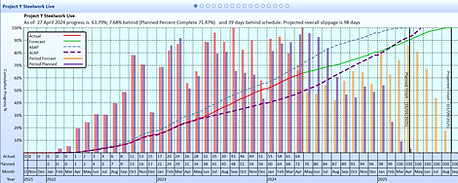
One Click S Curves, without Excel
Import from P6 and Microsoft Project. S Curves for duration, resource or cost. Include actual, forecast lines and baselines.

Period Graphs
View period data to smooth resources, understand bottlenecks and material usage
Create multiple S Curves from WBS, Code or Resource
See more of the detail by instantaneous creation of multiple S Curves, allowing analysis of what parts of the project and performing/underfperforming.


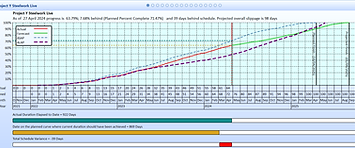
Advanced progress display
End date lines, progress lines and advanced progress disply help explain the status of the project
Oil and Gas, NZ
“Project Tracker is very affordable and our investment was paid back almost immediately”
Construction, USA
One of the main benefits of Project Tracker is the ability to produce S Curves at any level of WBS or by activity code.
Civils, SA
"The challenge for us was getting the reports out quick enough for our clients to review so they could mitigate any slippage. They predominantly ask for standard S Curves with a forecast curve"

Simple hassle free licensing
ProjectTracker is licensed on a per machine basis. It is available as an annual subscription, which includes support and upgrades during the subscription period.